
Challenge 01
Acquisition Costs Outpacing Margin
Every extra dollar of ad spend brings a more expensive customer than the last.
Revenue grows on the dashboard while profit quietly goes backwards.
Acquisition costs rise every year, so the winners are the stores that earn more from each customer. We run the full funnel: paid acquisition, product feeds, email flows and retention, measured on contribution margin.
Australians spent a record $82.6 billion online in 2025, up 13.9% in a year (Australia Post eCommerce Industry Report), and the competition has grown with it. Meanwhile Google found 53% of mobile visits are abandoned when a page takes longer than three seconds to load — so ad spend is often paying for traffic the site then loses.
We have worked with Australian retail and grocery groups since 2009, including Foodworks and IGA, and run acquisition and retention as one system from our Western Sydney office rather than as two disconnected budgets.


Illustrative trajectory for a 12-month eCommerce engagement combining paid acquisition with email and retention flows.
Measured on
Margin
Not revenue alone
Email flows
9 core
Built and optimised
Feed health
Daily
Monitored and fixed
Reporting
Weekly
Cohort and LTV
Most stores plateau at the same three points. Each one is fixable, but not by simply raising the ad budget.
Every extra dollar of ad spend brings a more expensive customer than the last.
Revenue grows on the dashboard while profit quietly goes backwards.
Roughly seven in ten carts are abandoned, and most stores send one reminder email.
The revenue is already in the building and it walks out unchallenged.
All the effort goes into finding new buyers while existing ones are never contacted again.
You keep paying full price for customers you already acquired once.
Acquisition and retention run as one system, because either alone stops scaling.
01/04
Titles, attributes and feed rules that win the product auctions that matter.
What's included
Store growth model
+56% / 12 moIndicative model for a structured engagement in a moderately competitive market. Actual results depend on your starting position, budget and sector — we forecast against your own data before any work begins.
Three things we insist on, because they are what separate a growing store from a busy one.
We load product-level cost of goods and shipping, then optimise on contribution margin. A 6x return on a low-margin line can lose money, and we will tell you so.
Learn moreEmail and SMS flows go live before we raise acquisition budget, so a higher cost per customer is offset by a second and third purchase.
Learn moreWe report blended return across every channel against total revenue, so no platform can claim the same sale twice and flatter its own numbers.
Learn moreUnderstand the unit economics, fix retention, then scale acquisition against a margin target you can actually defend.
We review analytics, product margins, repeat purchase rate and existing flows to establish what a profitable customer actually costs you today.
We assess competitor pricing, shopping presence, ad angles and offers to find where your range can realistically win.
We set channel targets against margin, plan the retention flows, and prioritise the products worth putting budget behind.
Feeds are rebuilt, campaigns launched, and the core email and SMS automations are written and switched on.
Weekly optimisation against contribution margin, with cohort reporting showing whether lifetime value is genuinely improving.
Revenue can rise while profit falls. We report the metrics that tell you which one is happening.
Total revenue against total ad spend across every channel, so no platform marks its own homework.
The share of store revenue coming from email and SMS flows and campaigns.
Customers who come back to buy again, tracked by cohort.
Revenue per order, lifted through bundles, free-shipping thresholds and recommendations.
A selection of the businesses we have supported with web design, development and digital marketing. Open any project to see what we delivered.
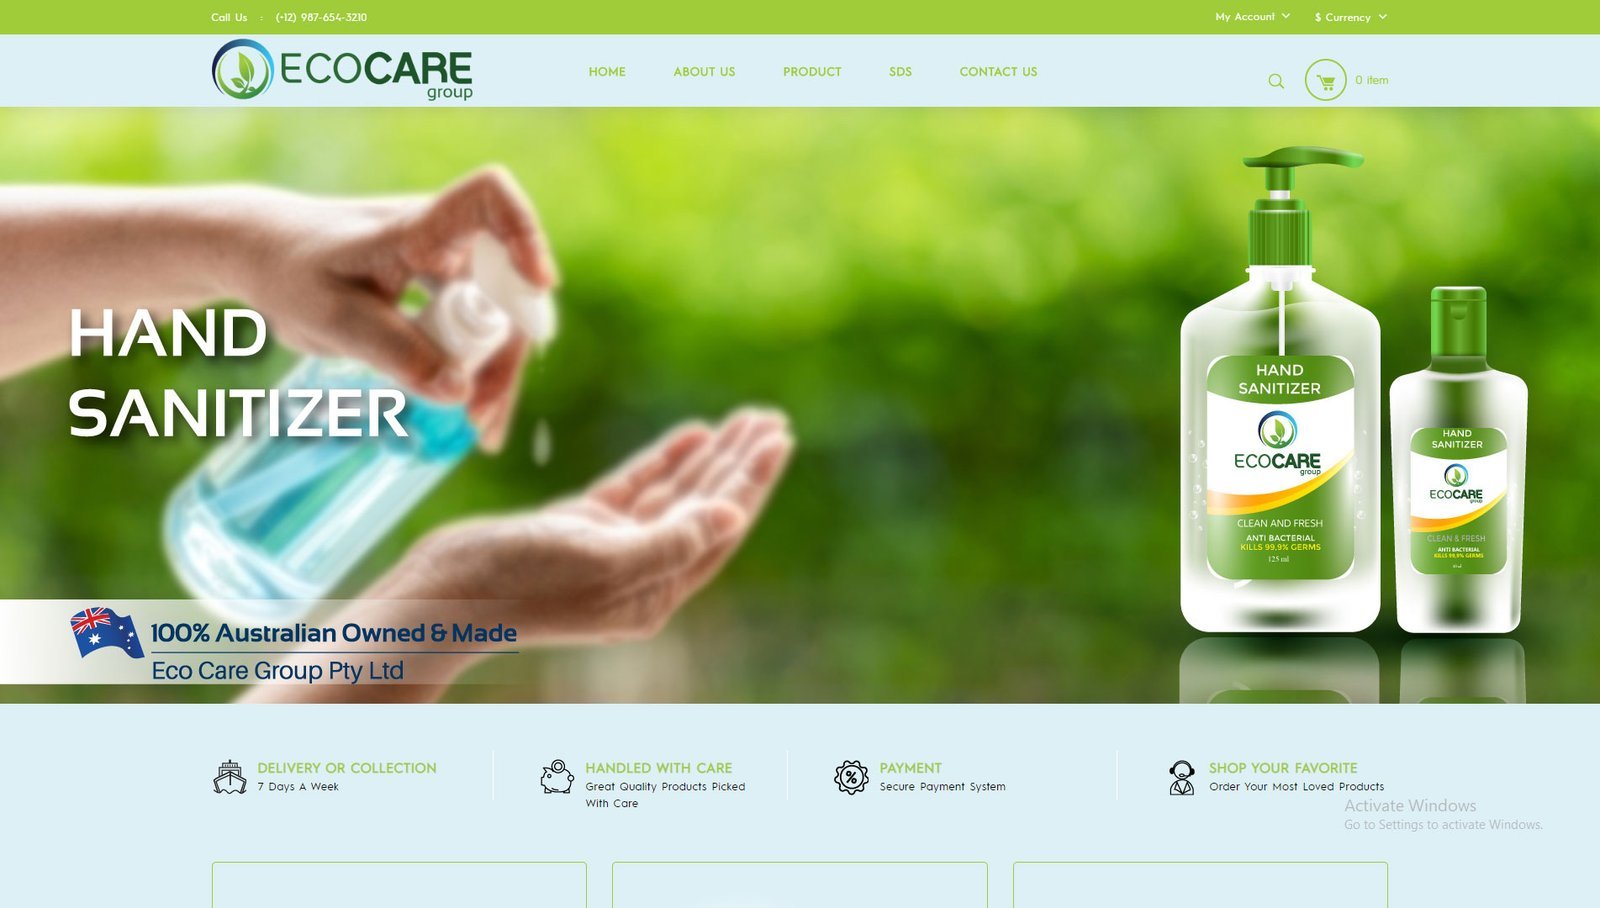 eCommerce design & development
An online store for an Australian-made hygiene brand.
Read case study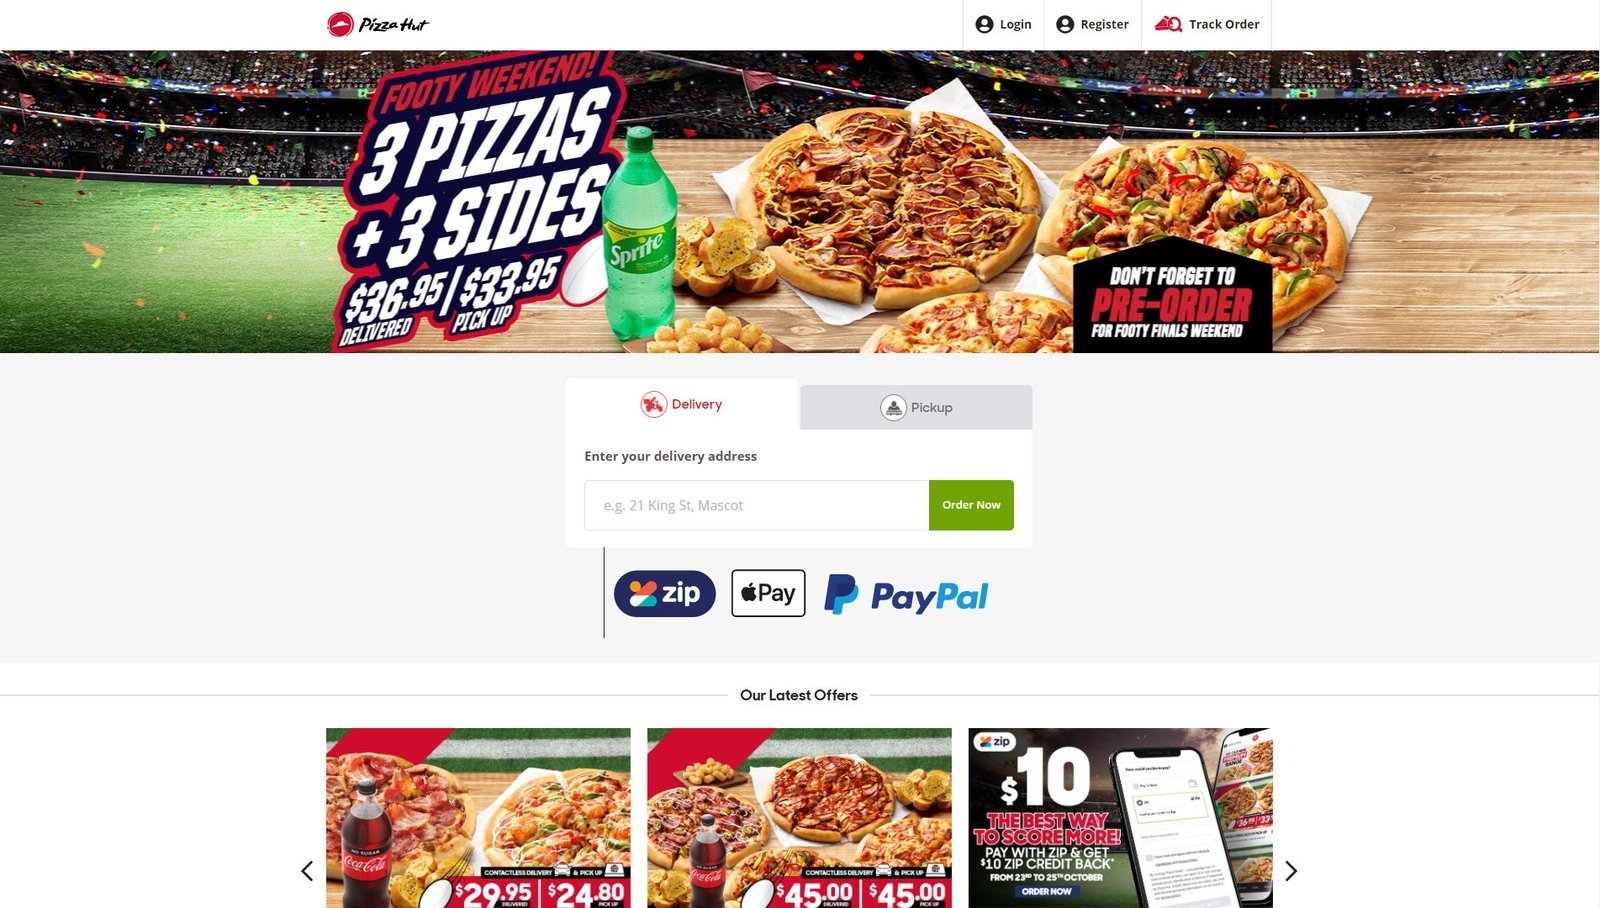 Digital marketing
 for one of Australia's best-known food brands.
Read case study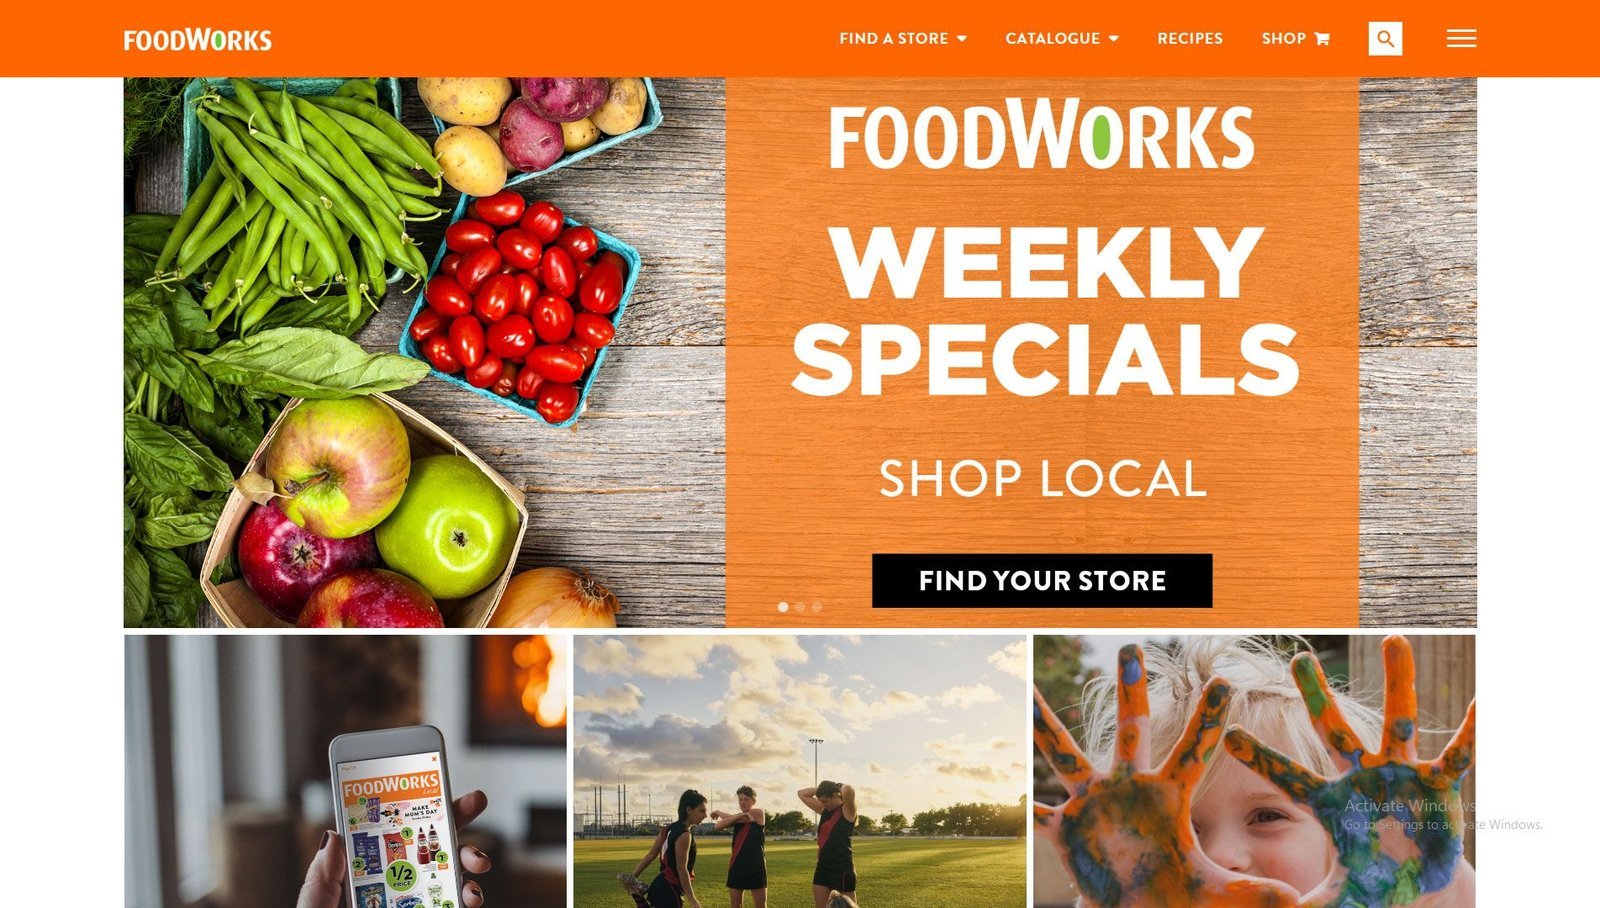 Digital marketing
 for an Australian independent supermarket brand.
Read case studySold as a monthly hour allocation. Ad spend and platform subscriptions are billed directly to you. Call 1300 189 687 for a scope and price.
For stores building their first growth engine.
For stores scaling acquisition and retention together.
For high-volume, multi-market stores.
Feedback from retailers who wanted their marketing judged against margin.
“Highly professional and creative team. Anna and Robert are a delight to work with, extremely friendly and patient. They did an exceptional job for us. Thanks guys!”
Rustam Sandhu
Ivisapoint
“Excellent work quality and hard working team. Very happy with their service and fast delivery of the products.”
Abdur Rahman
Techno Point
“Looking forward to working again with this dynamic and hard working team.”
Ashraf
ECO Care Group
Trusted by Australian brands since 2009
Foodworks · IGA · Pizza Hut · Hills · SMG Group · Beyond Care Australia · Eco Care Group
Foodworks & IGA
National grocery groups
Pizza Hut
Hospitality brands
Beyond Care & Embrace Ability
NDIS & care providers
What store owners ask us most before starting a growth engagement.
Our experts are ready to audit your online presence and guide your path forward.
Get in TouchIt depends entirely on your margin. A store with 70% gross margin can be profitable at 2x; one selling at 25% margin needs closer to 5x just to break even. That is why we load product costs first and set the target from your economics rather than quoting an industry average.
Because retention changes what you can afford to pay for a customer. If a buyer purchases twice instead of once, your viable acquisition cost roughly doubles. Building flows first means the extra ad budget lands on a store that converts and retains, rather than one that leaks.
We work across Shopify, WooCommerce, BigCommerce and Magento. Shopify and Klaviyo is the combination we see most often, but the strategy is platform-agnostic; only the implementation details change.
For a healthy store with proper flows, email and SMS typically account for 25% to 35% of total revenue. If you are currently below 10%, that gap is usually the fastest and cheapest revenue available to you.
Yes. Conversion rate work sits alongside this service, and our development team handles larger build work. If the audit shows your bottleneck is the product page rather than the ad account, we will say so before you spend more on traffic.
We use blended reporting: total revenue against total marketing spend, sense-checked with post-purchase surveys and platform data. Every ad platform over-claims when measured in isolation, so we never add their reported numbers together.
Book a free store audit. We will review your acquisition costs, retention flows and unit economics, and show you where profitable growth is actually available.
Get my free store audit No obligation. You keep the findings.